
Hospitality Real Estate in Cleveland, OH
In Cleveland, OH, accommodation businesses (NAICS 721) had 259 establishments, 5,651 employees, and $200.9 million in annual payroll in 2023 CBP. Food services and drinking places had 4,781 establishments and $1.8 billion in payroll. See the Cleveland, OH market overview for population, total jobs, and the metro snapshot.
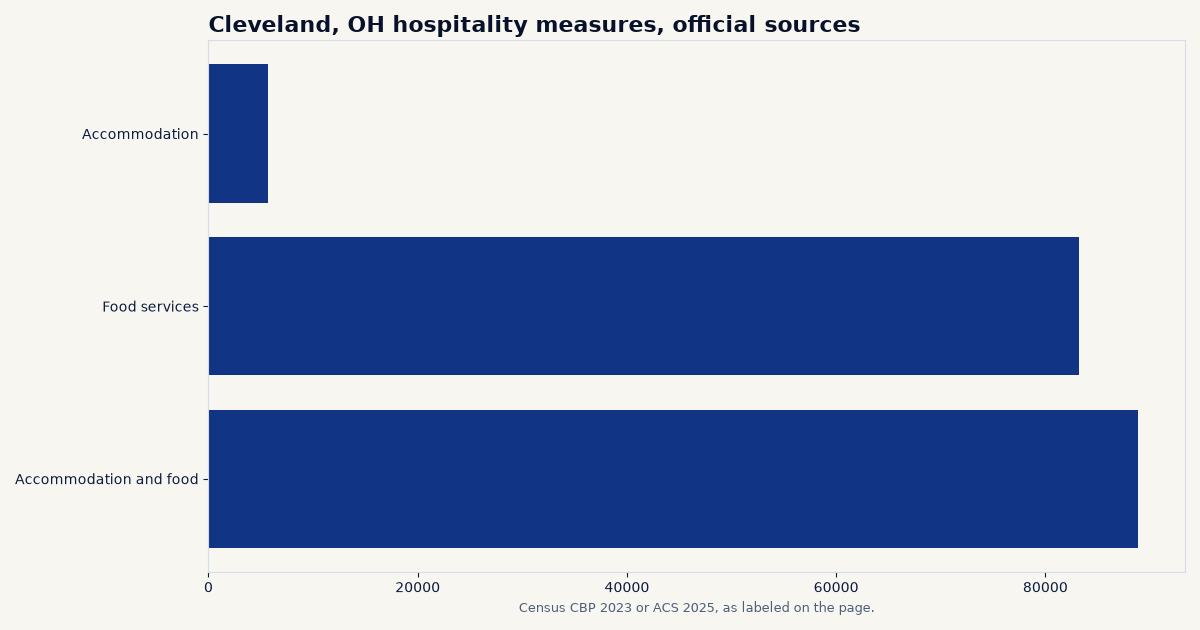
Rank among the 60 largest-population directory metros: #35 of 60 for hospitality employment (Census CBP 2023, 88,900 jobs).
What the public data show about hospitality in Cleveland, OH
This page reports CBP figures for accommodation (NAICS 721) and food services (NAICS 722) in Cleveland, OH, including establishments, employment, and annual payroll. There is no public hotel census or occupancy series in the files used here.
Establishments, employment, and payroll (Census CBP)
Cleveland, OH Hospitality Market Data
| Industry (NAICS) | Establishments, 2023 | Employment, 2023 | Annual payroll, 2023 | Employment change, 2022 to 2023 |
|---|---|---|---|---|
| Accommodation | 259 | 5,651 | $200.9 million | +2.9% |
| Food services and drinking places | 4,781 | 83,249 | $1.8 billion | +4.2% |
| Accommodation and food services | 5,040 | 88,900 | $2.0 billion | +4.1% |
Census County Business Patterns, 2023 and 2022, metro file. Annual payroll is converted from the survey's thousands of dollars. These are business counts and payrolls, not a property inventory.
Establishment size mix for Accommodation
| Employment size class | Establishments, 2023 |
|---|---|
| 1 to 4 employees | 83 |
| 5 to 9 | 43 |
| 10 to 19 | 49 |
| 20 to 49 | 58 |
| 50 to 99 | 18 |
| 100 to 249 | 6 |
Census County Business Patterns 2023 metro file, disclosed size classes only. Classes with zero establishments are omitted.
Detail by industry group
| Industry group (CBP 2023) | Establishments | Employment | Annual payroll |
|---|---|---|---|
| Traveler accommodation | 222 | 5,486 | $193.4 million |
| RV parks and recreational camps | 33 | 105 | $4.5 million |
| Rooming and boarding houses, dormitories, and workers' camps | 4 | 60 | $3.0 million |
| Special food services | 359 | 5,327 | $147.7 million |
| Drinking places (alcoholic beverages) | 345 | 2,923 | $69.0 million |
| Restaurants and other eating places | 4,077 | 74,999 | $1.6 billion |
Census County Business Patterns 2023 metro file, industry groups under the property-type NAICS listed above. Annual payroll is converted from the survey's thousands of dollars.
Compared with the U.S. and peer metros
In 2023, Cleveland, OH accounted for 0.29% of U.S. CBP employment in Accommodation. Annual CBP payroll per establishment was about $775,629 here, compared with $1,150,007 in the 50-state and D.C. total.
| Peer metro (overview) | Accommodation establishments, 2023 | Annual payroll, 2023 |
|---|---|---|
| Nashville-Davidson, TN | 467 | $626.3 million |
| Indianapolis-Carmel, IN | 351 | $232.1 million |
| Columbus, OH | 358 | $254.5 million |
| Kansas City, MO | 337 | $327.6 million |
Peer metros are other directory markets with similar 2025 population. CBP figures use the same NAICS code as the lead series on this page. Links go to each metro overview.
Related pages
Return to the Cleveland, OH market overview for population, total private jobs, rents, and the metro snapshot. National context: U.S. hospitality market data. Full directory: 120 U.S. metros.
Frequently asked questions
Does this page report hospitality vacancy or asking rents in Cleveland, OH?
No. Free federal sources used here do not report hospitality vacancy or asking rents for Cleveland, OH. This page reports County Business Patterns establishments, employment, and payroll for the hospitality-related NAICS codes listed below.
How is Accommodation measured?
Census County Business Patterns for 2023 reports establishments, employment, and annual payroll for that NAICS class in the Cleveland, OH metro. When a cell is suppressed, the page shows an estimate from the U.S. sector share and labels it estimated.
Where is the rest of the Cleveland, OH market?
Start with the Cleveland, OH market overview. National context is on the U.S. hospitality market data page. The 120-metro directory is at /markets/metros/.
What stands out in this market
The Cleveland, OH metropolitan area spans 6 counties in Ohio and ranks 35th in national population with 2,165,775 residents in 2025. Between 2020 and 2025, the population declined by 18,391 residents, or 0.84%. In 2025, net migration added 4,904 people, supported by 5,082 international migrants offset by a loss of 178 domestic migrants, alongside a natural population decrease of 2,431. Hospitality real estate demand is underpinned by a total covered employment base of 1,021,215 across 63,418 establishments. Within the broader service economy, the accommodation and food services sector accounts for 87,011 jobs across 5,166 establishments, while the accommodation subsector comprises 5,942 jobs and 277 establishments. Local commercial activity is further anchored by large employment bases in healthcare (175,566 jobs), manufacturing (122,354 jobs), and retail (96,091 jobs), alongside 44,598 jobs in finance and 55,775 in professional services, supporting both business and leisure travel across the metro area.
Cleveland, OH covers 6 counties. The largest by 2025 population are Cuyahoga County (1,232,925 residents in 2025), Lorain County (323,219 residents in 2025), Lake County (232,217 residents in 2025), Medina County (185,025 residents in 2025), Ashtabula County (96,713 residents in 2025). Census County Business Patterns for 2023 counted 259 accommodation (NAICS 721) establishments in Cleveland, OH with 5,651 employees and $200.9 million in annual payroll. Census County Business Patterns for 2023 counted 4,781 food services and drinking places (NAICS 722) establishments in Cleveland, OH with 83,249 employees and $1.8 billion in annual payroll. Accommodation employment in Cleveland, OH rose 2.9% from 2022 to 2023, from 5,493 to 5,651. Food services employment in Cleveland, OH rose 4.2% from 2022 to 2023, from 79,881 to 83,249. Among disclosed accommodation size classes in Cleveland, OH in 2023, CBP recorded 83 with 1 to 4 employees, 43 with 5 to 9 employees, 49 with 10 to 19 employees. Within Cleveland, OH, traveler accommodation had 222 establishments and 5,486 employees, with $193.4 million in payroll; restaurants and other eating places had 4,077 establishments and 74,999 employees, with $1.6 billion in payroll; special food services had 359 establishments and 5,327 employees, with $147.7 million in payroll.
Sources and data notes
- U.S. Census Bureau, County Business Patterns, 2023 and 2022. Metro file for local figures. U.S. comparison totals are the sum of all-legal-form state rows for the 50 states and the District of Columbia.
- Method details and limits are collected on the methodology page. Questions can be sent to richard@familyoffices.com.
Educational disclaimer
This page is for education only. It is not legal, tax, investment, or brokerage advice, and it is not an offer to buy, sell, or finance real estate or securities. CommercialRealEstate.com does not list properties and does not represent buyers or sellers. Questions about this data can be sent to richard@familyoffices.com.