
Hospitality Real Estate in Dallas-Fort Worth, TX
In Dallas-Fort Worth, TX, accommodation businesses (NAICS 721) had 1,368 establishments, 32,533 employees, and $1.3 billion in annual payroll in 2023 CBP. Food services and drinking places had 16,793 establishments and $8.4 billion in payroll. See the Dallas-Fort Worth, TX market overview for population, total jobs, and the metro snapshot.
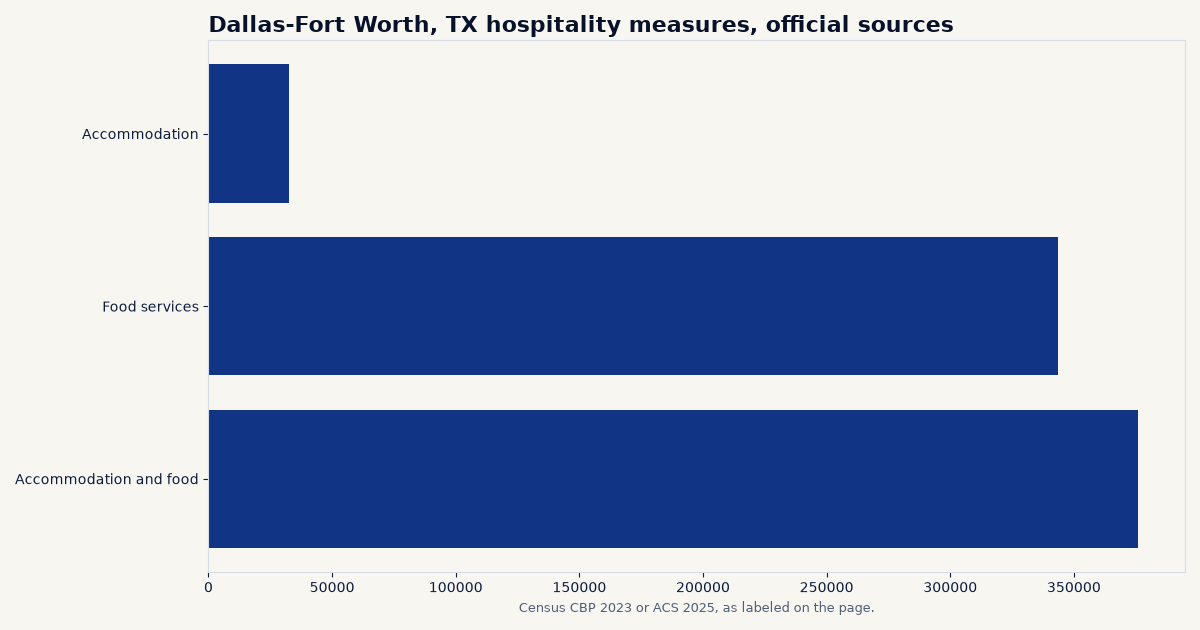
Rank among the 60 largest-population directory metros: #4 of 60 for hospitality employment (Census CBP 2023, 376,127 jobs).
What the public data show about hospitality in Dallas-Fort Worth, TX
This page reports CBP figures for accommodation (NAICS 721) and food services (NAICS 722) in Dallas-Fort Worth, TX, including establishments, employment, and annual payroll. There is no public hotel census or occupancy series in the files used here.
Establishments, employment, and payroll (Census CBP)
Dallas-Fort Worth, TX Hospitality Market Data
| Industry (NAICS) | Establishments, 2023 | Employment, 2023 | Annual payroll, 2023 | Employment change, 2022 to 2023 |
|---|---|---|---|---|
| Accommodation | 1,368 | 32,533 | $1.3 billion | +9.5% |
| Food services and drinking places | 16,793 | 343,594 | $8.4 billion | +8.8% |
| Accommodation and food services | 18,161 | 376,127 | $9.7 billion | +8.9% |
Census County Business Patterns, 2023 and 2022, metro file. Annual payroll is converted from the survey's thousands of dollars. These are business counts and payrolls, not a property inventory.
Establishment size mix for Accommodation
| Employment size class | Establishments, 2023 |
|---|---|
| 1 to 4 employees | 449 |
| 5 to 9 | 189 |
| 10 to 19 | 319 |
| 20 to 49 | 292 |
| 50 to 99 | 59 |
| 100 to 249 | 46 |
| 250 to 499 | 9 |
| 500 to 999 | 4 |
Census County Business Patterns 2023 metro file, disclosed size classes only. Classes with zero establishments are omitted.
Detail by industry group
| Industry group (CBP 2023) | Establishments | Employment | Annual payroll |
|---|---|---|---|
| Traveler accommodation | 1,272 | 31,940 | $1.3 billion |
| RV parks and recreational camps | 74 | 420 | $13.0 million |
| Rooming and boarding houses, dormitories, and workers' camps | 22 | 173 | $6.3 million |
| Special food services | 1,008 | 20,441 | $603.3 million |
| Drinking places (alcoholic beverages) | 548 | 9,344 | $254.4 million |
| Restaurants and other eating places | 15,237 | 313,809 | $7.5 billion |
Census County Business Patterns 2023 metro file, industry groups under the property-type NAICS listed above. Annual payroll is converted from the survey's thousands of dollars.
Compared with the U.S. and peer metros
In 2023, Dallas-Fort Worth, TX accounted for 1.66% of U.S. CBP employment in Accommodation. Annual CBP payroll per establishment was about $950,502 here, compared with $1,150,007 in the 50-state and D.C. total.
| Peer metro (overview) | Accommodation establishments, 2023 | Annual payroll, 2023 |
|---|---|---|
| Houston-Pasadena, TX | 1,357 | $843.0 million |
| Chicago-Naperville, IL | 988 | $1.8 billion |
| Atlanta-Sandy Springs, GA | 1,047 | $878.2 million |
| Washington-Arlington, VA | 741 | $2.0 billion |
Peer metros are other directory markets with similar 2025 population. CBP figures use the same NAICS code as the lead series on this page. Links go to each metro overview.
Related pages
Return to the Dallas-Fort Worth, TX market overview for population, total private jobs, rents, and the metro snapshot. National context: U.S. hospitality market data. Full directory: 120 U.S. metros.
Frequently asked questions
Does this page report hospitality vacancy or asking rents in Dallas-Fort Worth, TX?
No. Free federal sources used here do not report hospitality vacancy or asking rents for Dallas-Fort Worth, TX. This page reports County Business Patterns establishments, employment, and payroll for the hospitality-related NAICS codes listed below.
How is Accommodation measured?
Census County Business Patterns for 2023 reports establishments, employment, and annual payroll for that NAICS class in the Dallas-Fort Worth, TX metro. When a cell is suppressed, the page shows an estimate from the U.S. sector share and labels it estimated.
Where is the rest of the Dallas-Fort Worth, TX market?
Start with the Dallas-Fort Worth, TX market overview. National context is on the U.S. hospitality market data page. The 120-metro directory is at /markets/metros/.
What stands out in this market
Dallas-Fort Worth, Texas, is a large, fast-growing market across 11 counties. Its population reached an estimated 8,477,157 in 2025, up 10.6% from 2020. Net migration added 73,641 people in 2025, including 18,197 domestic and 55,444 international arrivals. The employment data point to several sources of business and visitor activity: manufacturing employed 308,574 people, retail 388,777, and transportation 246,742 in 2025. These industries, alongside population growth, shape a broad base of potential hotel demand. New construction is substantial across the metro: permits covered 66,179 housing units in 2025, including 24,607 units in buildings with five or more units. That housing data describes residential supply, not hotel construction. For hospitality properties, the official figures on this page do not give hotel inventory, occupancy, room rates, or lending, so they cannot establish whether hotel supply is keeping pace with visitor demand. The metro's population growth and sizable retail, manufacturing, and transportation workforces provide useful context, while property performance requires hospitality-specific data.
Dallas-Fort Worth-Arlington, TX covers 11 counties. The largest by 2025 population are Dallas County (2,661,397 residents in 2025), Tarrant County (2,248,466 residents in 2025), Collin County (1,297,179 residents in 2025), Denton County (1,069,346 residents in 2025), Ellis County (240,867 residents in 2025). Census County Business Patterns for 2023 counted 1,368 accommodation (NAICS 721) establishments in Dallas-Fort Worth, TX with 32,533 employees and $1.3 billion in annual payroll. Census County Business Patterns for 2023 counted 16,793 food services and drinking places (NAICS 722) establishments in Dallas-Fort Worth, TX with 343,594 employees and $8.4 billion in annual payroll. Accommodation employment in Dallas-Fort Worth, TX rose 9.5% from 2022 to 2023, from 29,704 to 32,533. Food services employment in Dallas-Fort Worth, TX rose 8.8% from 2022 to 2023, from 315,771 to 343,594. Among disclosed accommodation size classes in Dallas-Fort Worth, TX in 2023, CBP recorded 449 with 1 to 4 employees, 189 with 5 to 9 employees, 319 with 10 to 19 employees. Within Dallas-Fort Worth, TX, traveler accommodation had 1,272 establishments and 31,940 employees, with $1.3 billion in payroll; restaurants and other eating places had 15,237 establishments and 313,809 employees, with $7.5 billion in payroll; special food services had 1,008 establishments and 20,441 employees, with $603.3 million in payroll.
Sources and data notes
- U.S. Census Bureau, County Business Patterns, 2023 and 2022. Metro file for local figures. U.S. comparison totals are the sum of all-legal-form state rows for the 50 states and the District of Columbia.
- Method details and limits are collected on the methodology page. Questions can be sent to richard@familyoffices.com.
Educational disclaimer
This page is for education only. It is not legal, tax, investment, or brokerage advice, and it is not an offer to buy, sell, or finance real estate or securities. CommercialRealEstate.com does not list properties and does not represent buyers or sellers. Questions about this data can be sent to richard@familyoffices.com.