
Multifamily Real Estate in San Antonio-New Braunfels, TX
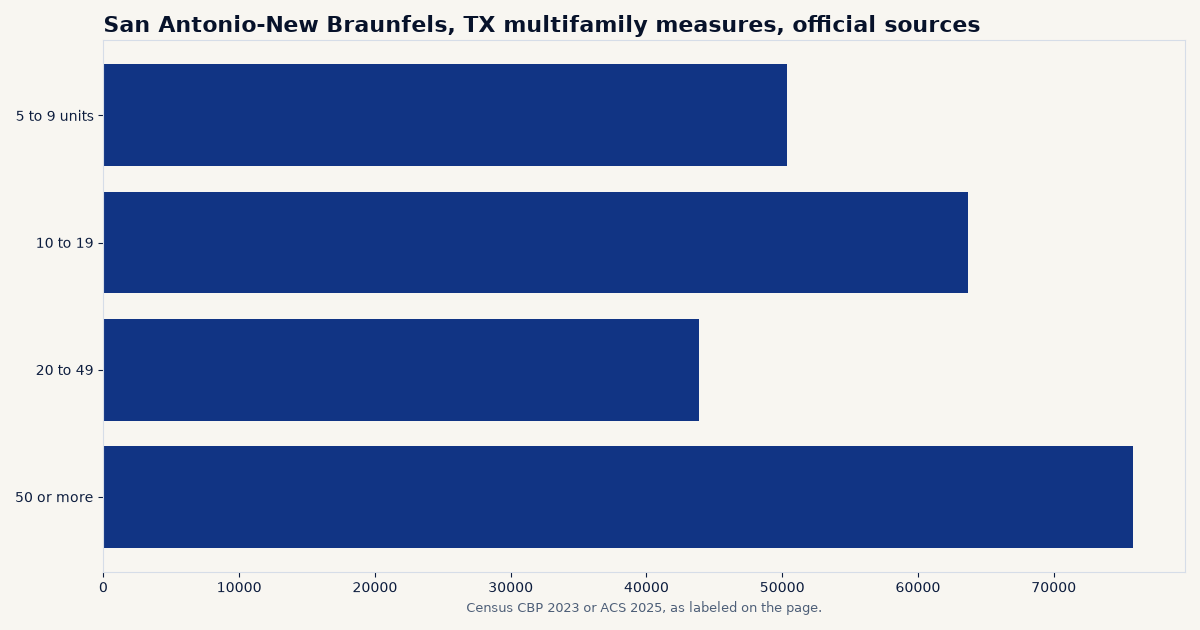
In San Antonio-New Braunfels, TX, ACS 2025 counts 75,875 housing units in buildings with 50 or more apartments, and median contract rent was $1,237. Lessors of residential buildings (NAICS 531110) had 467 establishments, 2,212 employees, and $104.3 million in annual payroll in 2023 CBP. The reported value of five-plus unit permits in 2025 was $398.0 million.
Rank among the 60 largest-population directory metros: #34 of 60 for residential-building lessor employment (Census CBP 2023, 2,212 jobs).
What the public data show about multifamily in San Antonio-New Braunfels, TX
This page focuses on multifamily-specific public series for San Antonio-New Braunfels, TX that are not the metro snapshot: the ACS mix of units by building size, contract rent and renter household counts, County Business Patterns for lessors of residential buildings (NAICS 531110), and the reported value of five-plus unit permits. Residential rents are not commercial asking rents, and these files do not include a complete apartment inventory or occupancy rate.
Establishments, employment, and payroll (Census CBP)
San Antonio-New Braunfels, TX Multifamily Market Data
| Industry (NAICS) | Establishments, 2023 | Employment, 2023 | Annual payroll, 2023 | Employment change, 2022 to 2023 |
|---|---|---|---|---|
| Lessors of residential buildings and dwellings | 467 | 2,212 | $104.3 million | -1.3% |
| Real estate and rental and leasing | 3,325 | 17,805 | $1.4 billion | +5.9% |
Census County Business Patterns, 2023 and 2022, metro file. Annual payroll is converted from the survey's thousands of dollars. These are business counts and payrolls, not a property inventory.
Establishment size mix for Lessors of residential buildings and dwellings
| Employment size class | Establishments, 2023 |
|---|---|
| 1 to 4 employees | 311 |
| 5 to 9 | 112 |
| 10 to 19 | 31 |
| 20 to 49 | 10 |
Census County Business Patterns 2023 metro file, disclosed size classes only. Classes with zero establishments are omitted.
Housing stock and renter households (ACS)
| Metric | Figure | Source |
|---|---|---|
| Units in buildings with 5 to 9 units | 50,364 | ACS 2025 1-year |
| Units in buildings with 10 to 19 units | 63,698 | ACS 2025 1-year |
| Units in buildings with 20 to 49 units | 43,897 | ACS 2025 1-year |
| Units in buildings with 50 or more units | 75,875 | ACS 2025 1-year |
| Units in 2-unit buildings | 16,054 | ACS 2025 1-year |
| Units in 3- and 4-unit buildings | 31,794 | ACS 2025 1-year |
| Renter-occupied households | 360,846 | ACS 2025 1-year |
| Vacant units listed as for rent | 37,871 | ACS 2025 1-year |
| Rented, not yet occupied | 4,652 | ACS 2025 1-year |
| Median contract rent | $1,237 | ACS 2025 1-year, rent excluding most utilities |
U.S. Census Bureau, American Community Survey 2025 1-year estimates. Unit counts by building size are not a professionally managed apartment inventory. Contract rent excludes most utilities.
Reported value of five-plus unit permits
| Year | Reported value of 5+ unit permits | Units in 3- and 4-unit buildings |
|---|---|---|
| 2019 | $718.7 million | 156 |
| 2020 | $665.8 million | 88 |
| 2021 | $1.1 billion | 103 |
| 2022 | $1.6 billion | 183 |
| 2023 | $953.2 million | 39 |
| 2024 | $520.4 million | 29 |
| 2025 | $398.0 million | 31 |
U.S. Census Bureau Building Permits Survey, annual data. Values converted from the survey's thousands of dollars. 2019 to 2023 use the metro delineations in effect for those years. 2024 onward use the July 2023 delineations, so earlier years may cover different counties. Permits are authorizations, not completions.
Compared with the U.S. and peer metros
In 2023, San Antonio-New Braunfels, TX accounted for 0.63% of U.S. CBP employment in Lessors of residential buildings and dwellings. Annual CBP payroll per establishment was about $223,257 here, compared with $260,077 in the 50-state and D.C. total.
| Peer metro (overview) | Lessors of residential buildings and dwellings establishments, 2023 | Annual payroll, 2023 |
|---|---|---|
| St. Louis, MO | 487 | $113.7 million |
| Baltimore-Columbia, MD | 509 | $171.0 million |
| Charlotte-Concord, NC | 621 | $211.6 million |
| Orlando-Kissimmee, FL | 674 | $162.2 million |
Peer metros are other directory markets with similar 2025 population. CBP figures use the same NAICS code as the lead series on this page. Links go to each metro overview.
Related pages
Return to the San Antonio-New Braunfels, TX market overview for population, total private jobs, rents, and the metro snapshot. National context: U.S. multifamily market data. Full directory: 120 U.S. metros.
Frequently asked questions
Does this page report apartment vacancy or asking rents in San Antonio-New Braunfels, TX?
No. It reports ACS unit counts by building size, contract rent, renter household counts, CBP data on residential lessors, and five-plus unit permit values. It does not report property-level occupancy or commercial asking rents. The San Antonio-New Braunfels, TX rental vacancy rate and median gross rent are on the market overview.
What is NAICS 531110 on this page?
It is the Census County Business Patterns class for lessors of residential buildings and dwellings. It is a count of those businesses, their employment, and their annual payroll, not a count of apartment units.
Where is the rest of the San Antonio-New Braunfels, TX market?
Start with the San Antonio-New Braunfels, TX market overview. National context is on the U.S. multifamily market data page. The 120-metro directory is at /markets/metros/.
What stands out in this market
San Antonio-New Braunfels is a Texas-only metro spanning eight counties. Its population reached an estimated 2,813,140 in 2025, up 9.5% from 2020. The metro added 27,316 people through net migration in 2025, including 18,763 domestic movers and 8,553 international arrivals. Employment includes 122,186 in retail, 67,500 in construction, and 59,297 in manufacturing, supporting a large regional base of renters and housing demand. Multifamily supply has been substantial: permits for buildings with five or more units totaled 13,738 in 2022, then fell to 7,248 in 2023, 3,803 in 2024, and 1,846 in 2025. In 2025, 233,834 homes, or 21.0% of the metro's housing stock, were in buildings with five or more units. The estimated rental vacancy rate was 9.4%, calculated from ACS rental occupancy counts, compared with 5.9% nationally. Median gross rent was $1,396, below the U.S. Median of $1,557. Together, these figures show a growing renter market alongside recent pullback in larger multifamily permits and higher estimated vacancy than the national rate.
Sources and data notes
- U.S. Census Bureau, County Business Patterns, 2023 and 2022. Metro file for local figures. U.S. comparison totals are the sum of all-legal-form state rows for the 50 states and the District of Columbia.
- U.S. Census Bureau, American Community Survey 1-year estimates, 2025.
- U.S. Census Bureau, Building Permits Survey, annual files for 2019 through 2025.
- Method details and limits are collected on the methodology page. Questions can be sent to richard@familyoffices.com.
Educational disclaimer
This page is for education only. It is not legal, tax, investment, or brokerage advice, and it is not an offer to buy, sell, or finance real estate or securities. CommercialRealEstate.com does not list properties and does not represent buyers or sellers. Questions about this data can be sent to richard@familyoffices.com.